- Event Study and Market Model Calculator
 Event studies find wide application in research in the fields of finance, economics and law. In finance and economics research, event studies are employed to investigate the effects of announcements of events such as changes in regulations, shocks in the macroeconomic environment, or company initiatives on stock prices or firm value. Event studies may, for example, be used to investigate the effects of board reforms, compensation, workplace safety, changes in taxation, pandemics, dividends and repurchases, equity and debt issuance, or mergers and acquisitions on stock prices. In the field of law, event studies have been used to determine damages in legal liability cases. Are you looking for event study help, market model help, event study help example, market model help example, or event study market model calculator? If so, you have every reason to read on.
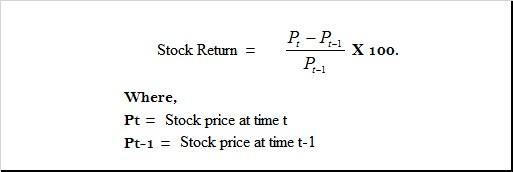
Event studies in the field of finance and economics often involve calculating statistics such as stock or security returns, market returns, expected returns, Cumulative Abnormal Returns (CARs), Averaged Cumulative Abnormal Return (ACAR), Average Abnormal Returns (AAR) (alternatively called averaged abnormal returns), and Cumulative Average Abnormal Return (CAAR). Stock returns and market returns can be computed using the simple formula or with compounding (using natural log). Calculating the aforementioned characteristics or statistics can be made easier and faster with the help of an event study market model calculator.
Simple formula for calculating stock returns:
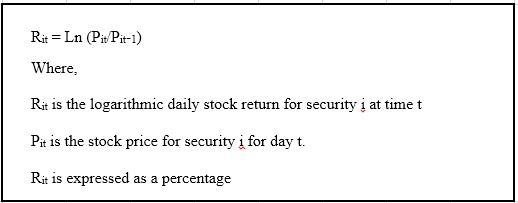
Formula for calculating stock returns with compounding
In event study theory, the market model among other models are applied towards determining the expected return based on the efficient market hypothesis. The other models that are commonly used to determine the expected return include the mean adjusted return model, the market adjusted returns model, the market model with Scholes-Williams beta estimation, the market model with GARCH(1, 1) and EGARCH(1, 1) error estimation, the Fama-French 3 Factor Model, and the Fama-French-Momentum 4 Factor Model. The market model, which apparently is the most commonly used model, is sometimes referred to as the Risk-Adjusted Returns Model (since it takes into account market risk), the Ordinary Least Squares (OLS) market model (Fama et al., 1969), the classic market model, the usual market model, or the basic market model.
The market model suggests that the return on stock i at time t is solely influenced by the market return at time t. When using the market model, expected returns are predicted through an OLS regression analysis that regresses stock returns on market returns (usually returns on a market index) over a predetermined estimation window. The relationship between the stock and the reference or benchmark index that has been used in the analysis is described by two parameters derived from the regression analysis: alpha (α) and beta (β). Alpha and beta are computed using data relating to the estimation period.
The expected return, E(Rit|Xt), is predicted using the model:
𝑬(𝑹𝒊𝒕|𝑿𝒕 ) = 𝜶𝒊 + 𝜷𝒊(𝑹𝒎𝒕) +𝜺𝒊𝒕
Where α and β are constants in the OLS regression model for i stock,
Rmt is the rate of return on the reference index (such as the FTSE 100, FTSE 250, FTSE All-Share, NYSE Composite (DJ), NYSE U.S. 100) on day t,
εit is the error term.
Calculate Expected returns, Abnormal returns, Cumulative Abnormal Returns Easily and Other Event Study Statistics
When performing an event study that applies the market model, you will most likely need to compute stock returns or securities returns, expected returns (ERs), abnormal returns (ARs), Cumulative Abnormal Returns (CARs), Averaged Cumulative Abnormal Return (ACAR), Average Abnormal Returns (AAR) (alternatively called averaged abnormal returns), and Cumulative Average Abnormal Return (CAAR). Additionally, you will likely need to determine descriptive statistics such as means, standard deviations, medians, modes, minimums, and maximums relating to different characteristics (such as abnormal returns and cumulative abnormal returns). Computing these statistics can be tedious, time consuming, and confusing especially when several firms/securities and long time periods are involved. However, an event study market model calculator makes computing these statistics easy, fast, and accurate. You can thus rely on an an event study market model calculator to compute expected returns, abnormal returns, cumulative abnormal returns and other event study statistics effortlessly, fast, and reliably.
A number of event study market model calculators or market model calculators, which are spreadsheet or excel files, have been developed to provide event study help and market model help to cater to different study situations. The event study market model calculators can be used to compute the different statistics for one or several companies/securities/stocks over several time periods (days/weeks/ months) at a time. These tools perform several functions and can thus provide you with invaluable event study help, market model help, and expected return help. The different market model calculators are designed to be:
- Market model calculator
- Market model excel calculator
- Event study calculator
- Event study excel calculator
- Stock returns calculator
- Benchmark market returns calculator
- Market model alpha and beta calculator
- Expected returns calculator
- Abnormal returns calculator
- Cumulative abnormal returns calculator
- Averaged cumulative abnormal returns calculator
- Average abnormal returns calculator (Averaged abnormal returns calculator)
- Cumulative average abnormal return calculator
Specifically, the tools compute the following statistics:
- Stock returns
- Benchmark/reference/market returns
- alpha and beta coefficients
- Expected returns
- Abnormal returns
- Cumulative abnormal returns
- Averaged cumulative abnormal returns
- Average abnormal returns
- Cumulative average abnormal return
- Descriptive statistics such as standard deviations, medians, modes, minimums, maximums, and percentage of positive abnormal returns.
Different Market Model Calculators for Different Needs
Here are four event study market model calculators worth considering for use in your event study and that are sure to make your work easier. Each of the calculators comes with test data that can serve as an event study help example or market model help example.
Event Study Market Model Calculator – V1.1A – This tool can be used with specific event period-estimation window combinations. Maximum stocks/companies/securities: 30. Maximum event period: 61 [-30, +30], Maximum estimation period: 20 to 49 (depending on when the event period starts). This event study market model calculator computes returns using the simple formula (not using natural log). This calculator comes with test data that can serve as an event study help example.
Event Study Market Model Calculator – V1.1B – This tool can be used with specific event period-estimation window combinations. Maximum stocks/companies/securities: 30. Maximum event period: 61 [-30, +30], Maximum Estimation period: 20 to 49 (depending on when the event period starts). Stock and market returns are calculated using natural log (compounded returns). This tool is similar to version V1.1A except for the formula used to compute returns. This tool comes with test data that can serve as a market model help example.
Event Study Market Model Calculator – V2.1A – This tool accommodates a wide combination of estimation periods and event periods . Maximum stocks/companies/securities: 100. Maximum event period: 61 [-30, +30]. Maximum estimation period: 320 to 349 (depending on when the event period starts). Returns are calculated using the simple formula. This calculator comes with test data that can serve as an event study help example.
Event Study Market Model Calculator – V2.1B – This tool accommodates a wide combination of estimation periods and event periods. Maximum stocks/companies/securities: 100. Maximum event period: 61 [-30,+30]. Maximum estimation period: 320 to 349 (depending on when the event period starts). This tool is similar to V2.1A, the only difference being that returns are calculated with compounding (using natural log (LN). This tool comes with test data that can serve as a market model help example. Having difficulty deciding which calculator to go for? You probably want to go with this calculator since it offers great flexibility and takes returns compounding into account.