Nitrogen Balance Experiment Using Simulated Urine Samples. Lab report results.
Attempted solutions for the following questions:
For this assay, you were asked to dilute your samples. Please explain in your own words why you think you were asked to do this.

You were also asked to make your own standards from a stock solution of 1mg/ml. Please indicate the amounts of stock solution and water you added to make 10mls of each of your own standards.
|
|
Blank |
0.25mg/ml |
0.5mg/ml |
0.75 mg/ml |
1 mg/ml |
|
Stock soln (ml) |
Provided |
||||
|
Water (ml) |
Provided |
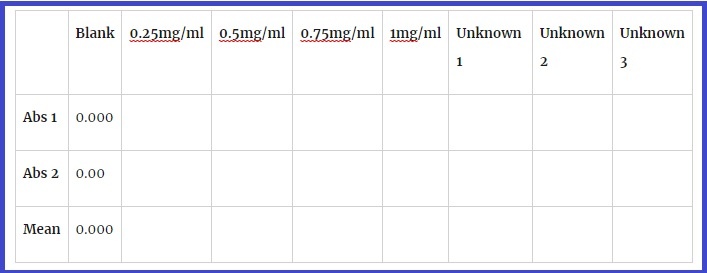
Calculate the average reading for each duplicate pair. You may find that one of the duplicate pair is not a good reading and may decide to leave that reading out. Discuss this with a demonstrator and outline in the tables below which sample you excluded and why.
From the absorbance you measured from your standards, graph using a scatter plot.
Once you have done so, attempt to fit a straight line through the standards. Are there any values skewing the line? Is the trendline showing a good fit with your experimental data?
Now using the result for the trendline from MS excel, report the equation and the R2 value
Once you have made the graph, determine the concentrations of the samples in the following 2 ways.
Use the equation given on your graphs (y = mx + c) calculate the concentrations of the unknowns.
** At this point – remember that you diluted your samples 1:20, so this means to get the ‘correct’ concentration you will need to multiply the concentration from the graph x 20.
|
|
Sample A |
Sample B |
Sample C |
|
Equation from graph |
|||
|
Equation from graph x 20 |
The samples you used for these assays came from a simulated 24 hour urine sample.
You have determined the concentration of urea in mg/ml. You will now need to convert that to total amount in the 24 hour urine, which was 2L.
So the total amount loss per day is amount calculated as x/ml × 2000 (i.e. 2000ml per 2L 24h urine sample)
|
|
Sample A |
Sample B |
Sample C |
|
Equation from graph (mg/ml) |
|||
|
Equation from graph x 20 (mg/ml) |
|||
|
Total amount loss per day (mg/day) |
|||
|
Total amount loss per day (g/day) |
Once you have calculated the concentration of each sample, think about which sample may apply to which of the following subjects.
What do abnormal results mean?
Complete the table and give your reasons below:
|
|
Description |
24h urine vol |
Subject weight kg |
Which Sample? |
|
Subject A |
Healthy vegetarian subject consuming 35g dietary protein per day |
2000 ml |
65 |
|
|
Subject B |
Obese subject undergoing therapeutic fast. 24 h urine sample from day 5 of fast |
2000 ml |
90 |
|
|
Subject C |
Healthy football player, consuming 75 g protein per day |
2000 ml |
80 |
Explain your choices: